An important step in many molecular biology protocols (including eDNA metabarcoding) is purifying and size-selecting DNA or PCR products. In preparing eDNA samples for metabarcoding, most protocols include purification and size selection steps after PCR amplification of target loci and/or after adding indices or barcodes by PCR before sequencing. There are several ways to purify and size-select DNA — examples include cutting target bands from a gel (effective, but labor-intensively awful), silica column kits (e.g., Qiagen MinElute), or solid-phase reversible immobilization (SPRI) beads (e.g., Ampure or similar).
SPRI bead protocols are one of the more common approaches because they are reliable and provide accurate size selection and purification. However, the beads are expensive and require refrigeration, and the protocol itself is difficult to carry out well. (It is also a long protocol, which also leads to high cost in technician time.)
In an attempt to speed up lab protocols and create a more user-friendly protocol, I tested two alternatives to SPRI bead clean ups for PCR products: 1) Exo-CIP Rapid PCR Cleanup Kit from New England Biolabs and 2) the Qiagen MinElute PCR Purification Kit.
Both kits are faster and easier than the SPRI bead protocol (here we used Omega Biotek MagBind beads). The materials are more expensive up-front, but because they are so much faster and easier, the total cost will be less when accounting for labor cost. Of important note, the Exo-CIP protocol only includes pipetting two times, and two very short incubations, resulting in ~7 minutes total for one sample but only ~1 minute of actual hands-on time. So, my question was, is this too good to be true or can we use one of these, preferrable the Exo-CIP instead of beads??

Need-to-know Methods
I tested these three different ways of purifying and size-selecting PCR products (three environmental samples plus a tissue-sample control of Kangaroo), comparing results via a Bioanalyzer and via sequencing on a Miseq.
(Details, for those who are curious): Briefly, I took DNA extracts and first used the MiFish-U (Miya et al. 2016) primers to amplify fish (and other vertebrate) DNA. The primers are both about 25 bp but also included the Nextera “overhang” in order to later attach Nextera barcodes, making the primers about 50 bp each. These PCR products were therefore about 270 bp long (~170 bp fragment + 50 bp F primer + 50 bp R primer). I then cleaned these products by either 1) Omega Biotek Magbind Beads, 2) NEB Exo-CIP, or 3) Qiagen MinElute columns. Cleaned PCR products were then used as template for a second PCR reaction where the primers attached a unique barcode to each sample before sequencing. The expected size fragment after this PCR was ~370 bp. The samples were then all cleaned a second time with the same method as the first cleaning. These samples were run on an Illumina MiSeq with ~100 other environmental samples. Bioinformatic analysis included Cutadapt and dada2 and then used the R package “insect” to assign taxonomy.
All of the methods are advertised as removing unused dNTPs and primers, but I expected the beads to perform best because the exact size-selection can be tailored by the ratio of beads to product used. I also wasn’t sure if the Exo-CIP (which uses Calf Intestinal Phosphatase aka CIP) would return sequences of only cow, which is amplified by the MiFish primers.
Difference in Sizes by Bioanalyzer
The MinElute and NEB Exo-CIP removed the vast majority of primers and dNTPs (but not all; see Bioanalyzer comparison below). The bioanalyzer of the MinElute samples showed a very small registered peak at 33 bp (about the size of the primers) and the Exo-CIP had a very small peak that was not large enough to be given a size by the bioanalyzer but can be visually seen around 30-40 bp. Note that in the SPRI and MinElute samples there is also a higher-than-target peak due to non-target amplification (target is ~370 bp and the MiFish primers are known to also amplify bacteria resulting in the ~470 bp peak).
Omega Biotek Beads

NEB Exo-CIP

Qiagen MinElute

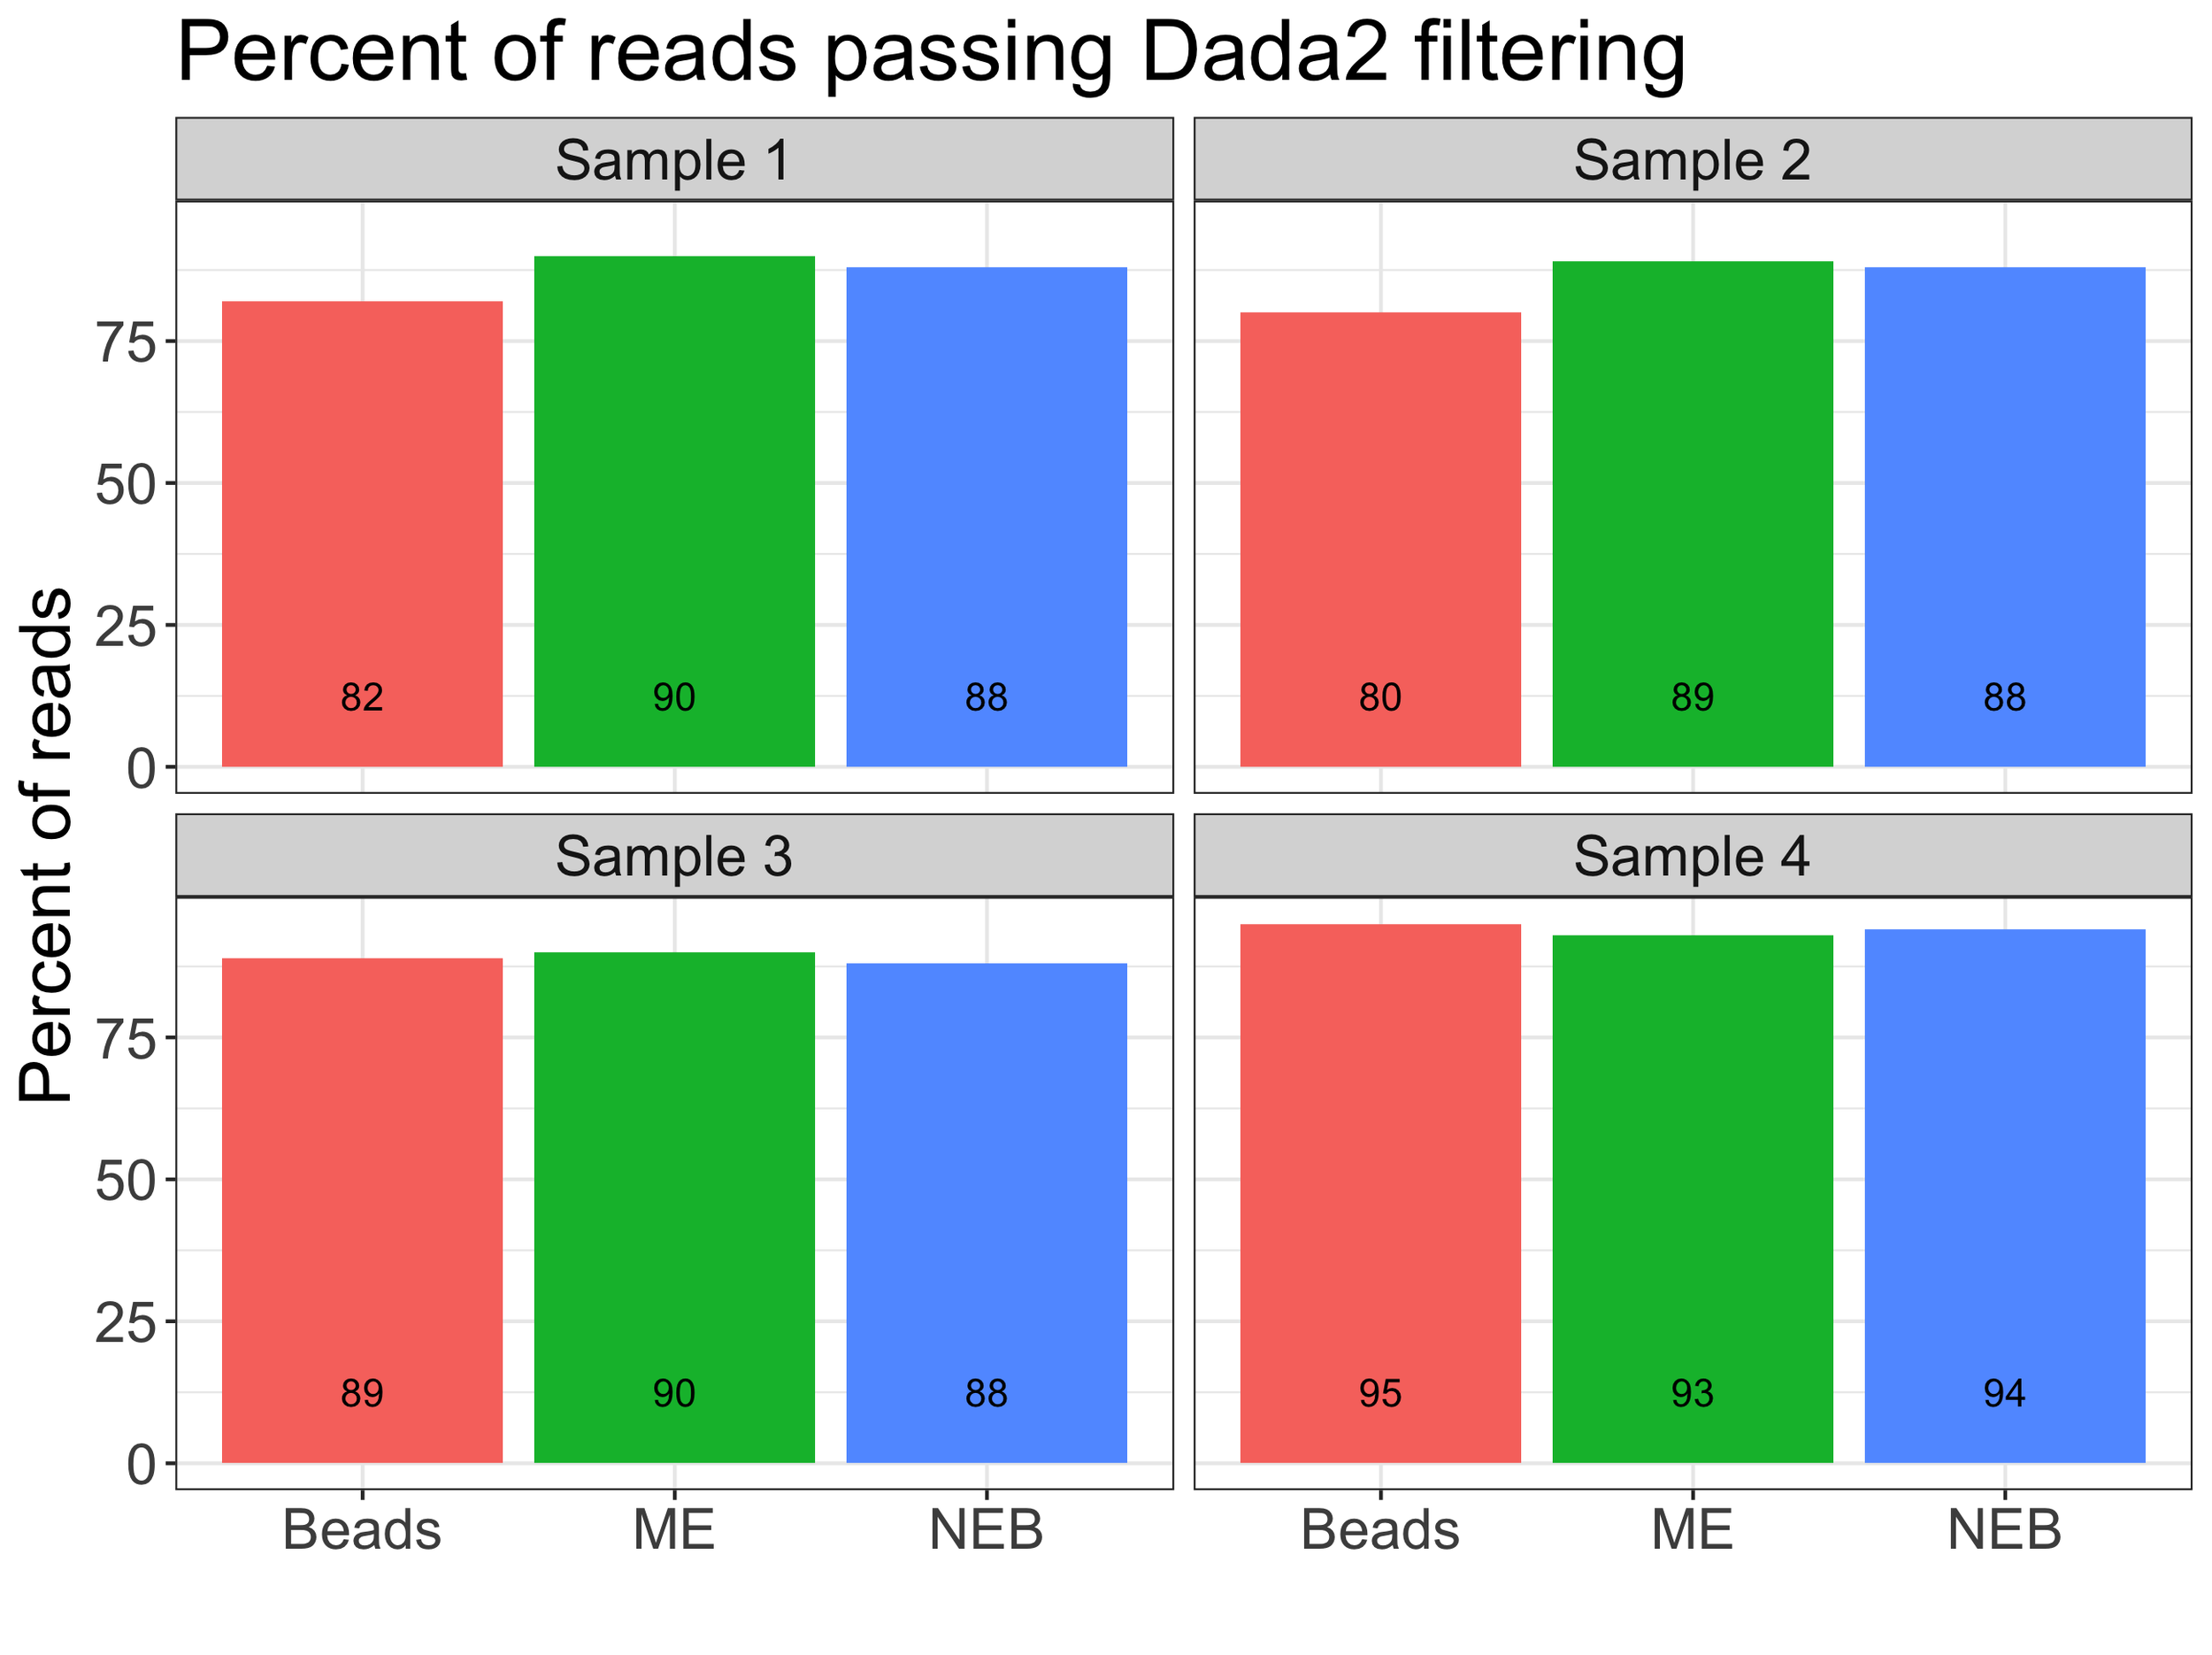
Dada2 Filtering Results
Next, I looked at the results from the sequencer after removing primers with Cutadapt and the cleaning and filtering of sequences and creating ASVs in dada2. There did not seem to be a pattern with lower percent of sequences passing the filtering steps in dada2 for MinElute (ME) or Exo-CIP (NEB) samples.
ASV Level Comparisons
Using the ASVs generated by dada2, we can look at the proportion of reads assigned to unique ASVs for the same sample but with different cleaning method. Here, each panel is a sample and then each bar represents a different cleaning method for that sample. The proportion of ASVs is similar for each sample across different cleaning methods (and note, different number of reads per sample/cleaning combination but still similar proportional representation of ASVs).

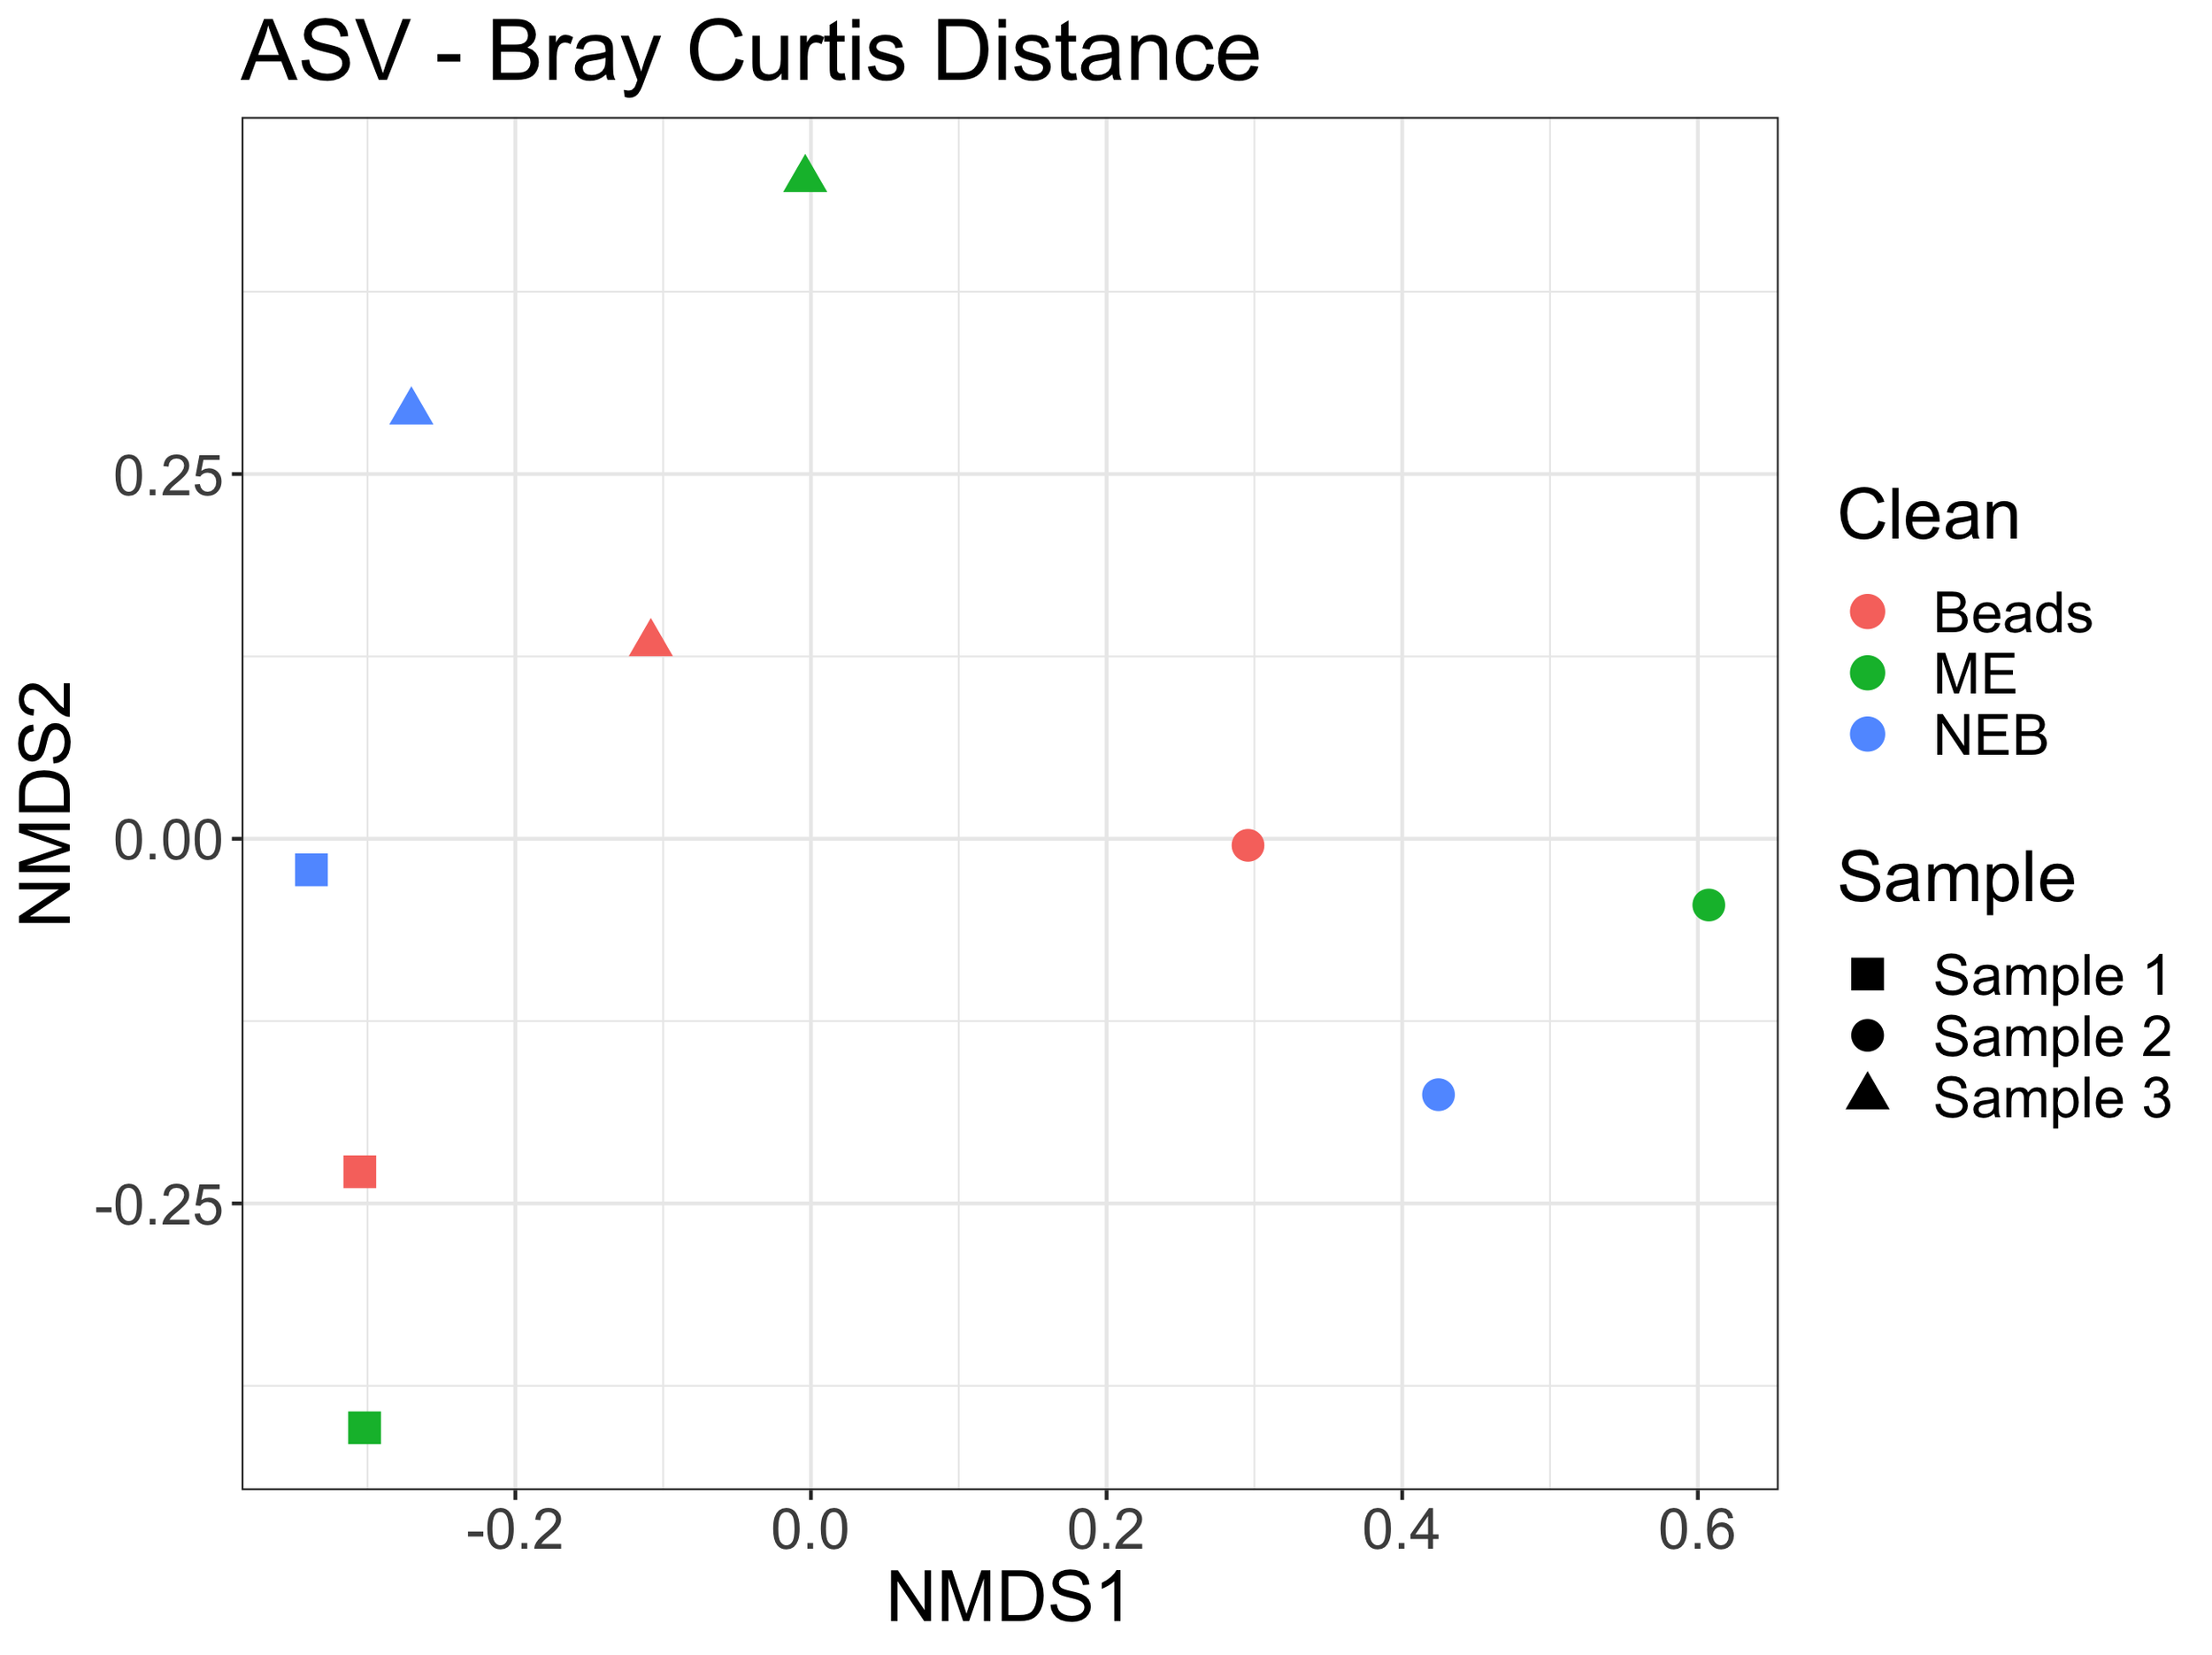
We can also visualize how samples cluster in an nMDS plot using the Bray-Curtis distances between samples and cleaning methods. Here, I removed the kangaroo samples as they drive major differences between samples. The environmental samples still cluster by sample type rather than cleaning method, demonstrating the difference in samples being larger than differences by cleaning type.
Level Bar Plots – Taxonomic Annotations
After assigning taxonomy to the ASVs generated in dada2 using insect in R, we can look at the proportions of different taxa found in each sample, and ask whether this varies by cleaning method. About 80% of the reads were able to be assigned to species level. Most studies use taxonomy rather than ASV-level analyses and here we demonstrate the similarities in taxa identified and relative proportions of taxa in each sample despite the different cleaning methods.
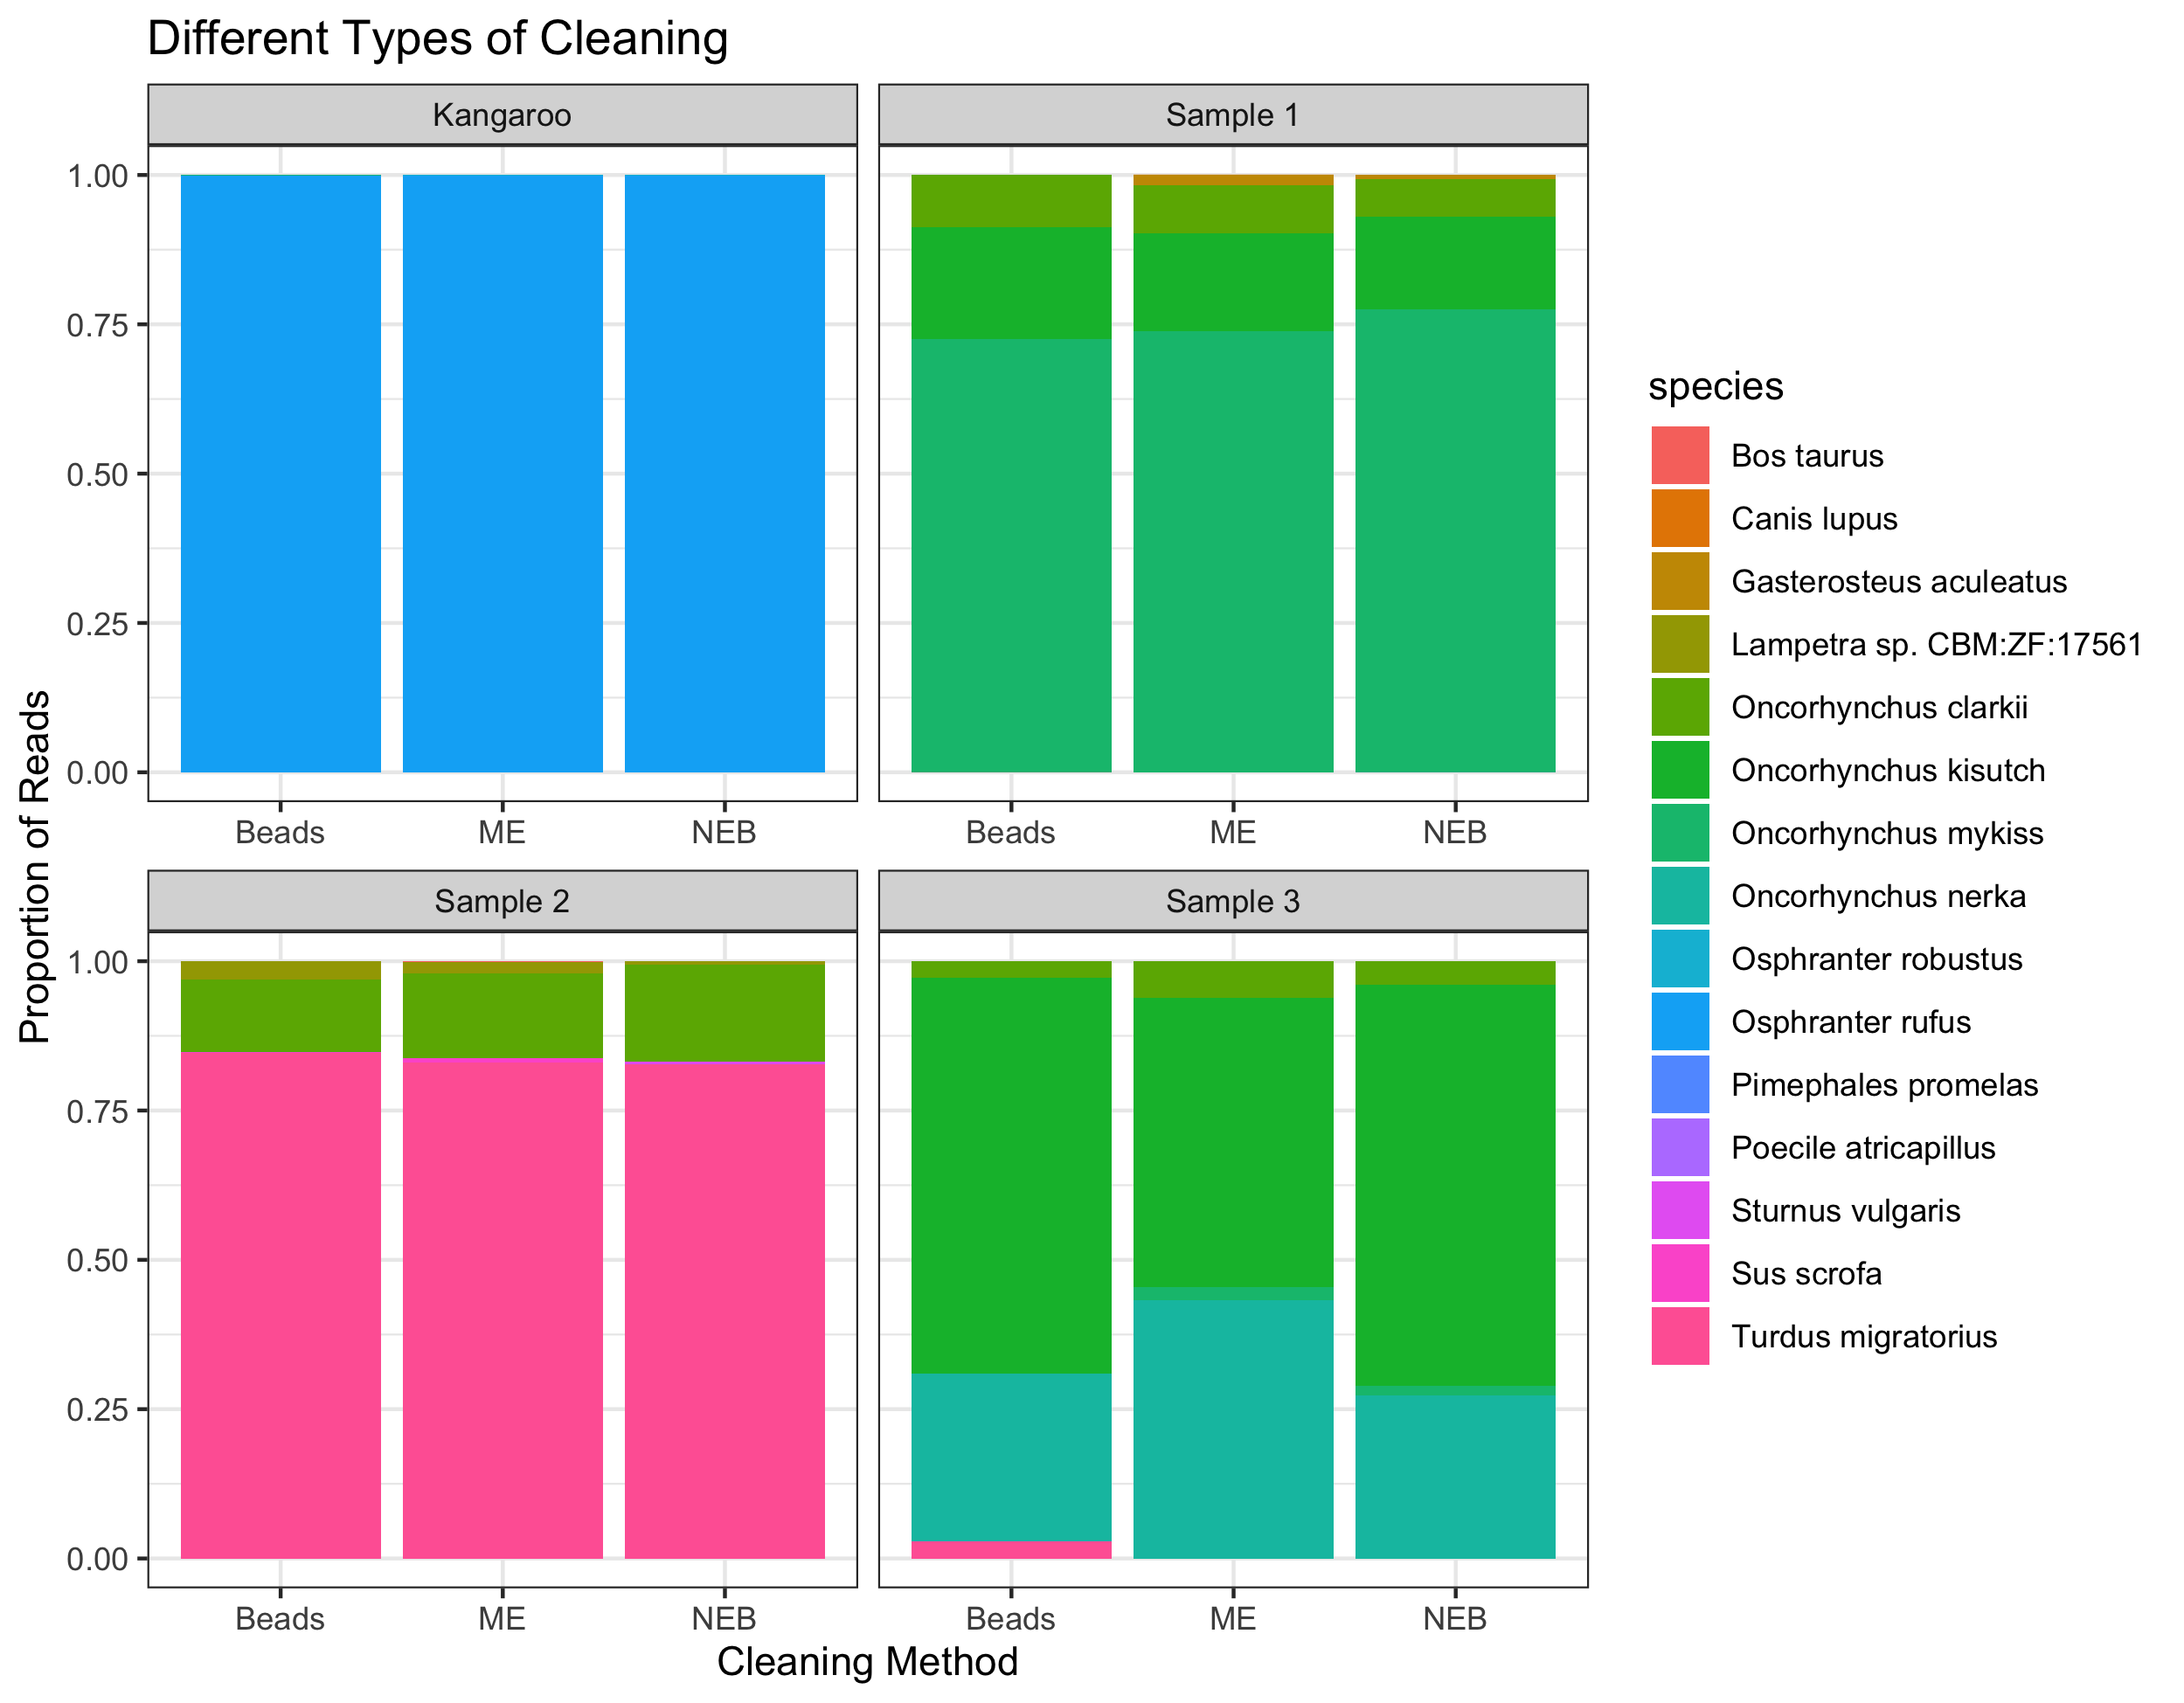
Also, a very important finding was that the samples cleaned with the NEB Exo-CIP were not swamped out by reads assigned to cow. In fact, cow was only found in one of the 12 samples, and it was cleaned by the MinElute column, not the Exo-CIP (note that we regularly find cow in these environmental samples so I was not surprised to find low levels of cow DNA).
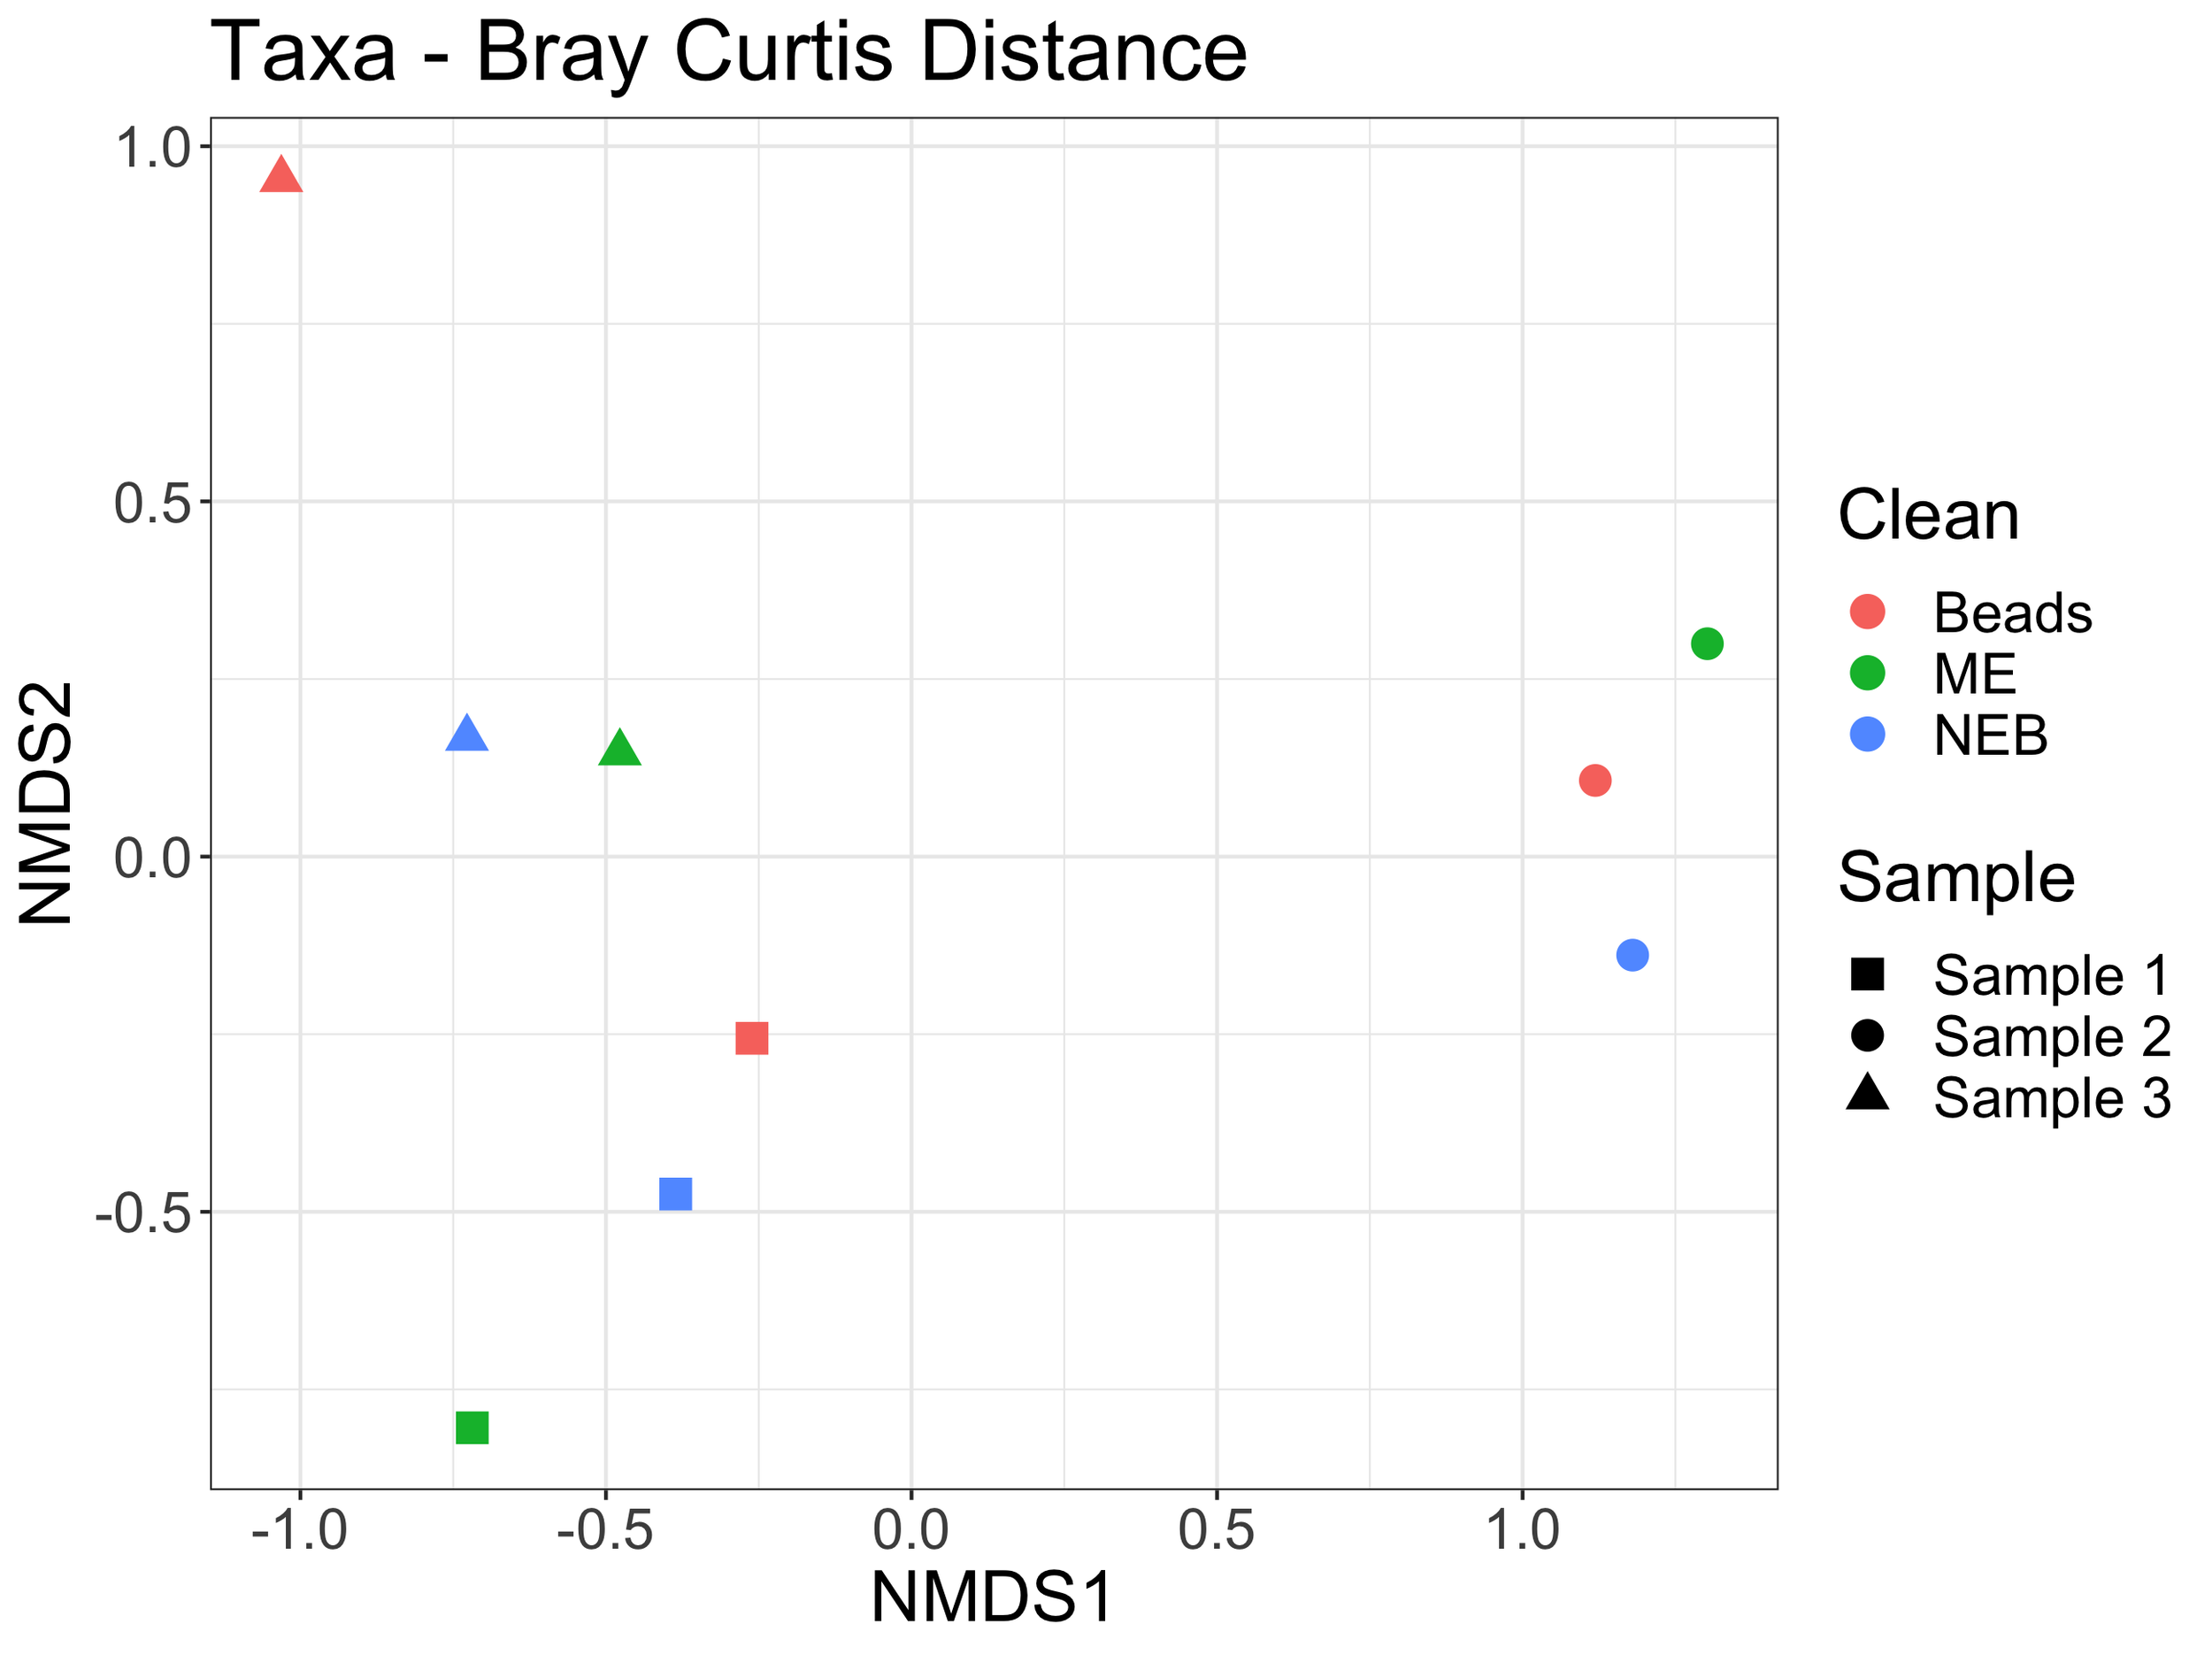
An nMDS plot of taxonomic level analysis also shows clustering by sample rather than cleaning method here as well.
Rather than looking at stacked bar charts, we can just look at the number of unique taxa found in each sample (i.e., richness). Sample 4 was a tissue sample of kangaroo, so here we will just look at samples 1-3, which are environmental samples with a mix of taxa present.
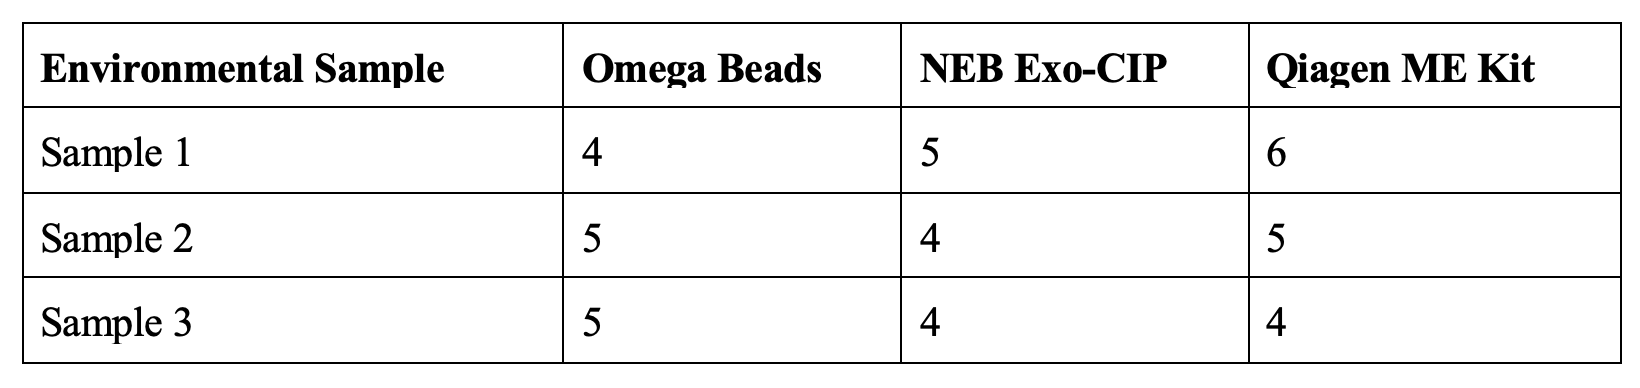
I only have three samples to compare, but there is no pattern with one clean up method consistently identifying more taxa than the other two methods. Also, with very low numbers of taxa identified, any differences are likely to be due to stochastic sampling (i.e., taxa that the pipette did not happen to sample when moving extract to PCR reaction or PCR product to cleaning, etc.), so the power to detect any meaningful signal here is limited. Nevertheless, the none of the clean-up treatments appears to have performed substantially differently from the others.
TLDR
We would love to not use SPRI beads for purifying and size-selecting PCR products in our eDNA protocols. I tested two alternatives here that are both much faster (the NEB Exo-CIP remarkably fast and easy) and found promising results that in three environmental samples and a positive control the sequencing results look very similar. We at the eDNA Collaborative are curious to hear if anyone else has tried other methods and has other ideas on alternatives to bead clean ups. Results shown here are from a MiSeq but would this also work on the Oxford Nanopore MinIon or other sequencing platforms? Please post questions/comments/thoughts! We would love to hear from you!